
PRINT LAB · semilog
Make semilog plotting paper
Use base-10 spacing on one axis while keeping equal divisions on the other.
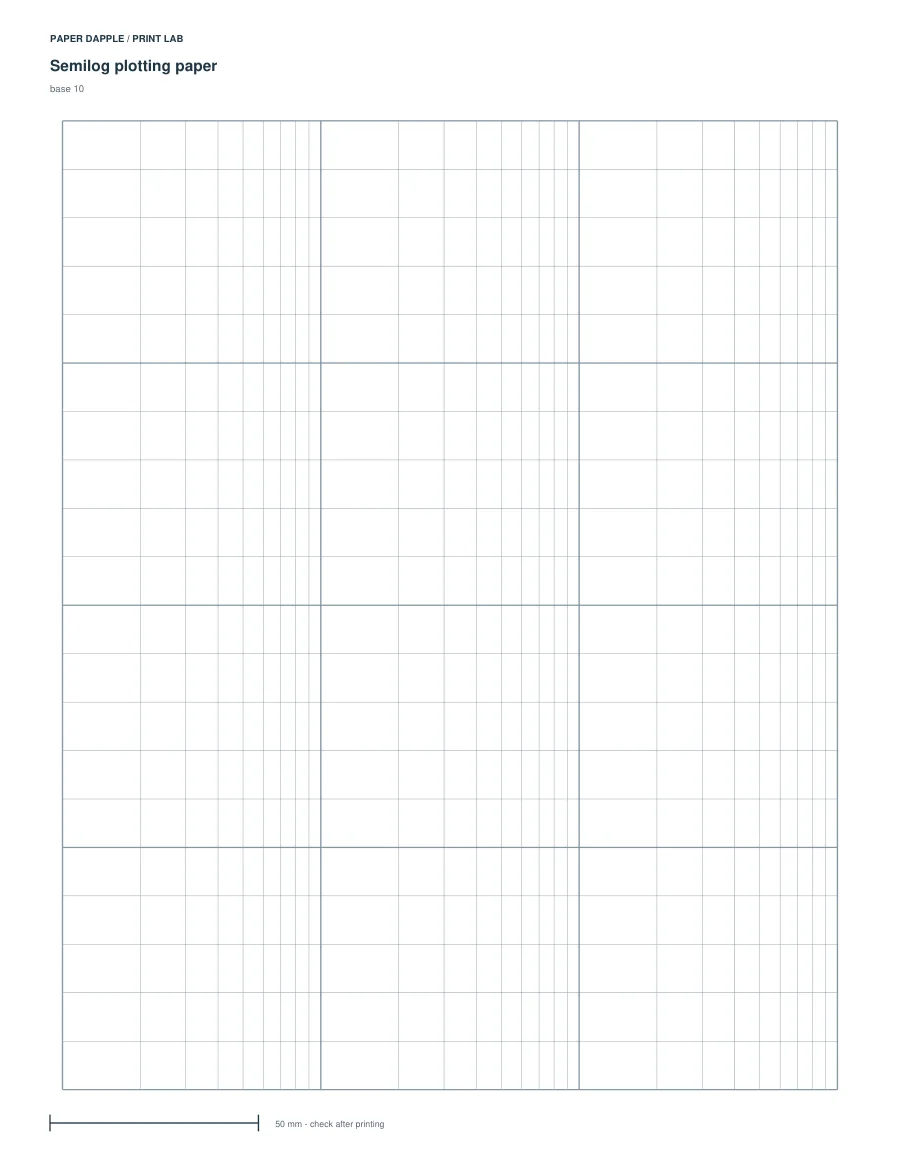
Actual generated example: semilog-three-decades, LETTER. Not a screenshot of invented output.
Try a clear starting point.
The sample has three logarithmic decades horizontally and a linear vertical grid. Supply your own starting values and units.
Open this example in Print LabOr inspect the example PDFs
- LETTER example PDF · 1 pages
- A4 example PDF · 1 pages
The example files are fixed outputs of the shown settings. The live tool can use other supported settings; it does not modify these downloads.
What you can adjust
Choose 1–6 logarithmic decades. Minor marks follow base-10 positions; the other axis retains equal divisions.
Choose Letter, A4, A5 or Half Letter and portrait or landscape. A paper profile being supported does not mean every parameter combination fits it; invalid layouts stop export.
What this tool does not promise
Logarithmic coordinates require positive values. The tool draws a grid; it does not transform or validate an imported dataset.
Ready-made PDF or generator?
The ready-made resource and this generator are separate alternatives. Compare their actual outputs; matching topic names do not establish identical dimensions or page contents.
Before printing
Inspect every output page, including answer pages where supplied. Use actual size for measured grids or objects, and measure the reference where present. The PDF cannot select your printer settings.